2: Temporal Nature
- Frederick DeNisco and Beatriz Fantini
- Nov 17, 2019
- 4 min read
Updated: Apr 26, 2021
The time is 2:50pm, you just finished your last lab of the semester and your favorite author is doing a new book reading at ___ with doors closing at 4:10 and you begin walking to the parking lot. You know the parking facility well, and maneuver your way back to your car with ease. Alas, you forgot it was a weekday in January.
Analysis based upon the temporal distribution of violations
The parking data provided by the city only contained the date where the violation occurred so our temporal analysis for this study is only on weekly and monthly scales.
Calendar Heat Chart
Our first section of graphics are calendar heat maps for the years of 2019, 2020 and the information up to April of 2021. These maps are all normalized to use natural breaks provided by the 2019 data for easier visual comparison. We created calendar heat charts for the prepared parking ticket data for each of the respective years. This type of graphic presents all of the information in an annual manner of which assumptions can be made for violations along the scale of seasons or months.
Data Clock
The data clock is another graphic type that can be utilized to show visualizations of data temporally, and for the purposes of this study is used specifically for visualizing intra-weekly, and intra-annual variations of parking violations. These were also created for each of the respective years to determine differences among times both before and during the COVID-19 pandemic.


2019
Prior to the pandemic, Vancouver saw fairly consistent parking violations across the year. There is an apparent amount of violations that appear during the winter, with particular patterns as well. The clusters of two and three days with more than 1809 tickets indicate that there may be a pattern regarding the days of the week as well as the time of year. While fall and winter appear to have the greatest number of tickets, this pattern is in fact apparent across the extent of this calendar heat map for 2019.

2020
Naturally, as the year the COVID-19 pandemic was introduced, there is an apparent lull in the amount of parking violations beginning in mid-March which is when the first lockdown was put into place. While the values seen here are less than that of those above, it is interesting to see such high volumes of violations as the year progressed. The lightening of restrictions that occurred in July is fairly apparent and remained fairly consistent all the way into November. That being said, there is a mild decrease around mid November when restrictions were put in place to account for the holiday season.

2021
With the least data, 2021 comes in as the mildest of the three years observed with an apparent lack of any days with more than 1809 violations. While the violations per day are less, there are more consistent days over 696 violations than that of 2020, of course this is still far less consistent than that of 2019. We would not expect the violations in 2021 to exceed that of 2019 of course as regulations are still in place, however their consistency and mildly high average should be recognized.


2019 A Little Closer
Looking at the first visualization, the months indicate a pattern similar to that described for the 2019 calendar heat map above. The wintertime plays host to the most prominent amount of tickets, and in this graphic it becomes apparent that the summer is host to the second largest collection of tickets per season.
The second graphic, which shows the extent of the violations per day of the week, provides us with insight about the individual patterns we mentioned above. The majority of the tickets appear to have been given during weekdays more-so than weekends. This is most likely due to stricter regulations on the road during weekdays.


2020 An Apparent shift
While the pandemic laid claim to Vancouver and the world during 2020, that did not stop the trend of parking violations occurring largely during both ends of winter that year. The lack of tickets in the early summer months is very apparent and as mentioned in the calendar heat chart above we again see an increase in tickets around July when restrictions slightly lifted from the quarantine that occurred. Furthermore, the decrease in violations that was mentioned earlier is also apparently seen in November and December as the violations declined.
The second graphic, like the previous year's, shows the extent of the violations per day of the week. These tickets are far more spread out, indicating that their violations were not necessarily due to weekly restrictions but a great number of other variables. The small white ring in the center also constitutes a lack of violations as it represents the tickets for those months when quarantine was first in effect.

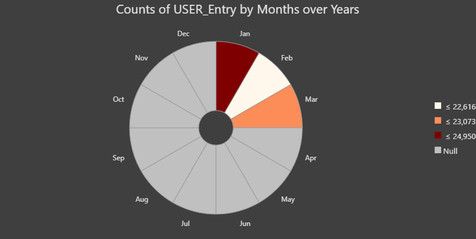


2021 To Today
January having the largest number of violations is no surprise when looking at the information of both 2019 and 2020, even as the first January since the pandemic. Due to the lack of data about the rest of the year as it has not occurred yet, there are not other visible or recognizable trends.
The tickets in the second graphic are more spread out, much like that of those in 2020, indicating that their violations were not necessarily due to weekly restrictions as well. We have deemed this apparent lack of weekly temporal patterns to be due in whole to the pandemic as the population is no longer moving in synchrony.


A Broader Look
The three graphics above are normalized to the ranges of 2019 to visualize the quantitative differences in the amount of tickets being given. The other visualizations utilized natural breaks to aid in particular differences within each of the data sets. While January and winter in general were seen to be bearers of relatively high tickets for each year, the graphics above indicate that even as of January 2020 there has been an exponential decrease in the amount of violations that were given.
There is still an apparent decrease in tickets during the beginning of the pandemic here in March and April of 2020. Furthermore larger trends such as the increase in violations during fall and the decrease after October are still apparent, however muted in comparison to the vast amount prescribed in 2019.


Comments